
የሲዳማ ቡና ኣብቃዮች ሚና በኣከባቢ ጥበቃ
THE ROLE OF LIVESTOCK IN MITIGATING LAND DEGRADATION, POVERTY AND CHILD MALNUTRITION IN MIXED FARMING SYSTEMS: THE CASE OF COFFEE-GROWING MIDLANDS OF SIDAMA - ETHIOPIA
Introduction
Land degradation in the tropics is strongly associated with human population growth. The latter phenomenon is quite marked in humid areas and in the temperate highlands (Jahnke 1982). Notably in the plateaux of Sub-Saharan Africa and Asia, several pastoral systems have gradually evolved into mixed farming, in order to cope with such pressure (Ruthenberg, 1980). Land is more intensively utilized as population density increases since mixed systems are more efficient than specialized crop or livestock systems (McIntire et al.,1992). In fact, livestock crop integration allows:
- to diversify production,
- to distribute labour and harvest better throughout the year as well as distribute tasks among the different components of the household (HH),
- to recycle waste products within the system, preventing nutrient losses,
- to minimize the risk and the effects of livestock and crop pests;
- to improve indigenous husbandry techniques and knowledge, hence
- to intensify and control more efficiently input - output flows, increasing productivity and minimizing risks.
Livestock provide not only draught power, manure, milk, meat and by-products. As in traditional pastoral societies, they have cash buffer and insurance functions. The former function also supports the use of inputs in crop cultivation which in turn generates higher on-farm productivity for both crops and livestock (Brumby, 1986).
On the other hand, human population growth is responsible for decreasing land plot size. In Rwanda and Burundi, this pressure led to stocking rates much lower than in other East African highlands (50 TLU/km2 vs. 100–130 TLU/km2, according to the zone) due to increasing conversion of pasture into cultivated land (de Leeuw and Reid, 1995). In these areas, the doubling time of human population is around 20 years. In Sidama, Southern Ethiopia, a similar pattern was already described in 1975 by Ayele who stated that “cultivation has been and is invading livestock grazing areas. As population increases, people prefer to cultivate crops rather than breed livestock”.
The progressive disappearance of livestock is a key destabilizing factor responsible for the involution of the system characterized by nutrients deficiencies and degradation. It may lead to conflicts between different groups sharing resources within the system. This trend is more evident in the absence of marketing opportunities for livestock and/or crop products (Ruthenberg, 1980; Steinfeld et al., 1997).
In Sidama Awraja (or district) a WHO/UNICEF Joint Nutritional Support Programme (JNSP) was implemented during the second half of the 1980's. The area was selected because it presented a variety of environmental, socio-economic and cultural situations. This study, carried out as part of the programme activities, illustrates the role played by livestock in alleviating land degradation, poverty and the resulting child malnutrition in integrated systems.
The Sidama Awraja
Located in the northern part of Sidama Province, the Sidama Awraja occupies some 5900 km2, with a human population of 1.5 million. The Awraja is one of the most densely inhabited areas of Ethiopia, with 254 people/km2, in contrast to the national average of 32 people/km2.
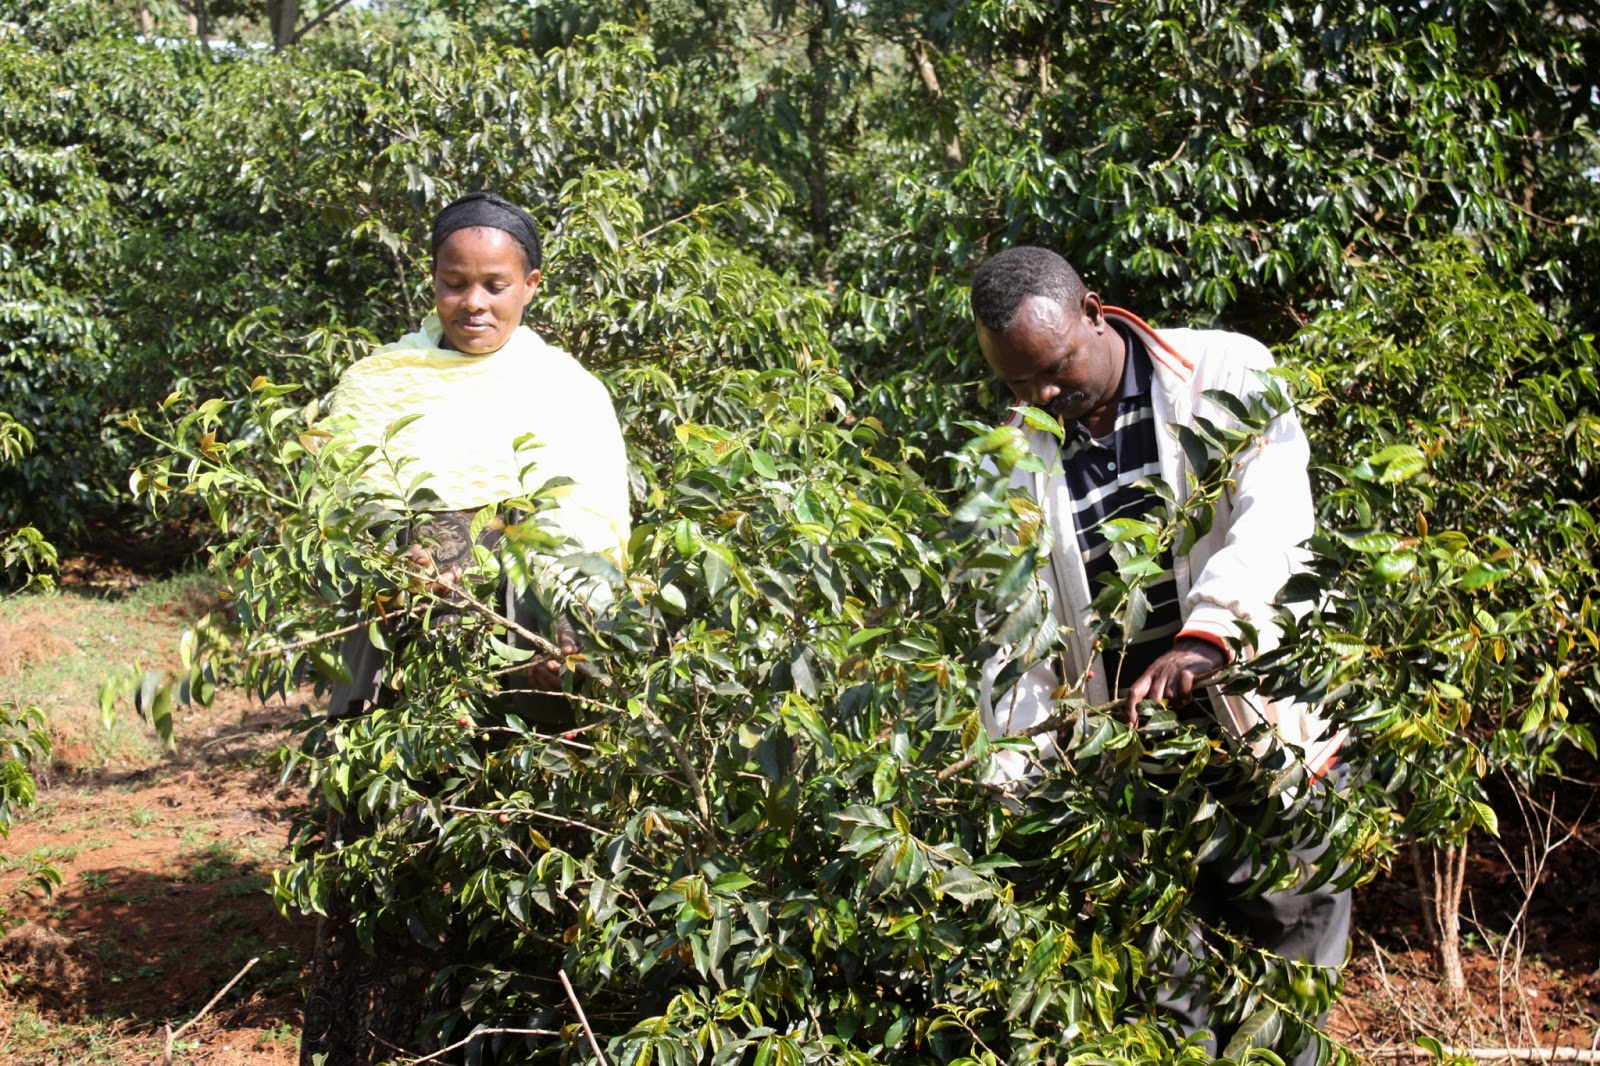
The region is divided into three main ecozones, each with different agricultural systems and development potential, (Figure 1). The lowlands are situated in the Rift Valley and range between 1100 m and 1600 m in altitude. Because of poor soil and an average annual rainfall of only 400 mm, the main human activity in this zone is pastoralism. The next belt, the midlands, ranges from 1600 to 2000 m and averages more than 1500 mm of precipitation annually. About 70% of the Awraja's human population is concentrated in this very fertile zone (Raya, 1987). It has sustained rapid population growth because it provides a favourable environment for agriculture and development. The farming system, a combination of horticulture and animal husbandry, is characterized by the cultivation of false banana (Ensete ventricosum), which is the principal staple food, and cash crops. Major cash crops include coffee (Coffea arabica, a wild shrub indigenous to southern Ethiopia) and chat (Catha edulis, whose leaves are chewed as a stimulant). Incomes in the midlands are considerably higher than in the other two zones and in the rest of Ethiopia (Anonymous, 1984). A tarmac road and the majority of the Awraja's dirt roads are found in the midlands, as are the main services and the regional and district capitals. The territory above 2000 m constitutes the highlands, whose potential for cereal production has not yet been fully exploited also because of poor communication networks. At present, abundant pasture allows highland farmers to raise large numbers of livestock, including horses that supply most of the transport in this zone.
The principal ethnic group in this zone is the Sidama, a Cushitic-speaking people. Traditionally cattle raisers, their way of life has changed, especially in the midlands, as cultivation is invading grazing areas. For example, seasonal movements towards neighbouring highlands in search of better pasture are practised no more. Nowadays, they live together with the Oromo pastoralists (the Guji) who used to be their traditional enemies. “Sidama”, which means “foreigner” was the name used by the Oromo during their expansion from the eastern Ethiopian highlands into the Awraja (Biasiutti 1959). Other ethnic groups found in the area are the Wolaita and the Amhara.
The study
JNSP activities were concentrated in the midlands of Sidama. According to the results of a baseline survey carried out by the programme, 36% of children in the Awraja had chronic and 41% acute malnutrition. The problem was surprisingly more severe in the midlands.
A key question still needed an answer: within the same community, which are the most vulnerable HHs and why?
Several studies have clearly pointed out the influence of the socio-economic status, as well of environmental factors, on child malnutrition (Payne, 1977; Nabarro, 1981; Victora et al., 1986). The proportion of malnourished children within a community is a powerful indicator of the level of access to basic resources from vulnerable groups. High prevalences are the symptoms of a system under stress and they are often associated with scarcity, degradation or mismanagement of available resources, including inequity. According to Jonsson (1984) the main underlying causes of the phenomenon are: insufficient HH food security, inadequate child care, and insufficient basic health care.
The present study was carried out in 1988 as part of programme activities in order to:
- describe the main features and constraints of the prevalent farming system in the midland:
- identify key determinants of child malnutrition, with particular emphasis on food security and HH economics.
Materials and methods
The study design hinged upon:
- the results of JNSP activities in the area, notably a performed baseline survey and ongoing regular growth-monitoring sessions;
- the direct involvement of local community workers (i.e., community development, health and agricultural workers) also in order to emphasize the intersectoral and participatory approach of the exercise.
The data were collected mainly through:
- rapid rural appraisal,
- HH questionnaires, and
- direct observations.
- Rapid rural appraisal techniques were adapted from Conway (1985) and developed in order to analyse livestock productivity, HH economics and market prices in a better way (Ghirotti, 1992). During meetings with farmers, results were interpreted and discussed with the assistance of community workers.
- 102 heads of HH, out of the 109 originally selected, were interviewed in four selected villages of the midlands: Telamu, Sedeka, Weinenata and Ferro. Data on age-sex distribution of the interviewed households are in Figure 2. These villages were involved in the programme (JNSP) activities and the sample was drawn from a list of HH's. All the interviews were performed in the local language through a trained interpreter during house-to-house visits. They took place in August, a period which corresponds with the beginning of the new Sidama traditional year and the end of the Ethiopian calendar. It was then easier for the farmer to recall events of the previous year. The methodology was tested in a fifth village (Wondo). The results of this pilot trial were not included in the study.
- At the end of each interview, some selected features (e. g., land plot size and conditions, type and quantity of cultivated crops, number and type of livestock owned) were verified utilizing HH conditions, as well as ownership of a functioning radio set and type of bed, as wealth indicators. The previous year's coffee production of each HH was checked at the local Peasant associations (PAs) where the harvest had to be sold.
Further information about the study area and methodology can be obtained from a previous publication (Ghirotti, 1995).
Risks factors in child malnutrition
Ninety eight HHs, in the selected villages, fulfilled the basic criteria for being involved in a case - control study. All of them having a child below three years of age (13-24 months included) with weight for age above 90% of the median of the Harvard reference population (hence well nourished) or with weight for age below 65% of the median of the Harvard reference population (hence severely malnourished). They were divided in two extreme groups in order to identify main determinants of malnutrition. The study was performed as single blind: information on the nutritional status of the children belonging to the interviewed HH were deliberately obtained only at the end of all the interviews in the concerned PA. The two major working hypotheses were:
- child malnutrition is associated with the income level of the HH,
- it is also associated with the degree of efficiency in land utilization.
At the same time a parallel and integrated investigation analyzed the role of maternal care and mother knowledge/attitude in the same HHs (N. Zagaria, unpublished document).
The income of each HH was estimated by making a calculation of the farm gross output of the year (according to the recorded production parameters), of ownership of goods, livestock and other sources of HH income. Data were computed into a spread-sheet format. Items were converted into monetary figures, i.e. Ethiopian Birr (at the time of the study 1 US$=2.05 E. Birr), according to local market prices.
Income pro capita was calculated by dividing the estimated gross income for the total number of HH members. The coefficient for children below five years was 0. 4, for family members between 5 and 15 years of age was 0. 75 and for members above 15 years was 1.
Efficiency in agricultural production was estimated by dividing the gross income for the size of the land holding (Spedding, 1981). Management was evaluated by comparing the husbandry practices of the two groups (HHs of well-nourished and HHs of malnourished child) to identify differences in their behaviour, if any, associated with production improvement (e. g. ; use of inputs, frequency of weeding and other husbandry practices, level of livestock care, diversification of production strategy, priorities in expenditures).
Data analysis
Data were analysed either comparing means with ANOVA or using chi-squared to test hypotheses. A Mantel - Haenszel stratified analysis was then carried out. The correlation coefficient was calculated to establish eventual relationship between selected variables. P values less than 0. 1 (10%) were considered as statistically significant. A statistical package EPI-INFO was used for the analysis (WHO-CDC, 1990).
Results
The farming system
HH composition and land plot size:
The average HH size is 6.5 persons (S. D. = 2.24). Its composition is given in Figure 2. Polygamy was found in 19 HHs. Three farms were led by a woman. 95.1% of the farmers cultivate less than one hectare of land (see table 1). The average land plot is 0. 4 ha. Its size is not associated with income (P>0. 1). The recorded population density in the area is 525 people/Km2 (see Table 2).
The average HH size is 6.5 persons (S. D. = 2.24). Its composition is given in Figure 2. Polygamy was found in 19 HHs. Three farms were led by a woman. 95.1% of the farmers cultivate less than one hectare of land (see table 1). The average land plot is 0. 4 ha. Its size is not associated with income (P>0. 1). The recorded population density in the area is 525 people/Km2 (see Table 2).
Income: The comparison between the means of the income recorded in HHs of the four villages, showed that the difference is not significant (P>0. 1). It was then assumed that the selected villages are rather homogenous. On-farm activities are the main source of income for 99 HHs (97.1%). Coffee and livestock production largely contribute to family income (over 80%), the former as a source of cash, the latter as an asset. The selling of cash crops (coffee, chat, sugarcane and other fruit) and dairy products provides most of the ready money available, on average 17% of the gross income, to buy farm inputs and to meet other HH expenditures. During the year of the study, 61 (59.8%) farmers worked either for other farmers or for the local producer co-operatives in order to obtain extra cash or, more frequently, food. Income generated from agricultural activities was integrated in 15 HHs (14.7%) with casual labour (e. g., brickwork), in 6 (5.9%) with handicraft production and in 4 HHs (3.9%) with alcohol sale. Income was not associated with the surface of cultivated land nor with the HH size (P>0. 1)
Crop Production: In the midlands, the garden is a combination of different food and cash crop species. The ensete plants form the higher canopy under which humidity is maintained and where coffee, kale (Brassica carinata), yam (Dioscorea abyssinica), sweet potato (Coleus edulis) and other vegetable and fruit trees are planted. The climate, with mild temperatures and water surplus for most of the year, is favourable to crops but also to weed growth. Soil fertility in the garden is kept and even increased by the daily spreading of the manure collected overnight. The floors of traditional housing are constructed in such a way that the urine of livestock kept indoor overnight drains into the garden. However, heaps of unused manure were noticed near some plots as well as land degradation in sloped or grazing areas. Maize is cultivated separately in rows, together with kale, beans and spice plants.
The frequency of the HHs cultivating the most important crops is summarized in table 3. Because of the small size of land plots, the main agricultural tool is a local bamboo hoe. The plough is used only by few farmers who cultivate more than one ha of land.
Ensete plays a central role in the life of Sidama people. It furnishes the main staple food which is potentially available throughout the year, fibre for handicrafts, ropes, leaves for shelter, by-products for animal feed. Preferably when the plant is 6-8 years old, the pseudostem is scraped in order to obtain “bula”, the most valuable food made from the juice, and “wasa”, which is obtained from fermentation of the solid residue and can easily be stored in the ground for over two years. Production per plant is about 30 kg though an eight years old plant can produce up to 40 kg of wasa.
All the farmers interviewed cultivate maize. Teff (Eragrostis teff), wheat and barley are cultivated by a few farmers (in seven, three and two HHs respectively) owning more than 0. 6 ha of land.
Production of coffee, the main cash crop, was not associated with plot size (P>0. 1). Fruits like orange, banana, avocado, guava and papaya have the function of cash crops, diversifying the HH economy and providing some petty cash when other sources are not available, especially for farmers in villages near the major markets and roads.
Because of the low but diversified production through the year, little is stored. Most food is eaten or sold within weeks from harvest, with the exception of was which can be prepared any time during the year.
Only 2.9% of the farmers interviewed use improved maize seeds. Fertilizers, mainly bought from free marketing, are employed by 21.6% of them and their use is associated with high income (P<0. 01). Nineteen (18.6%) farmers obtained information on how to improve their agricultural production, mainly coffee. Figure 3 shows the major constraints in crop production identified by the heads of HH. Among other causes, farmers mentioned the difficulty to obtain loans.
Livestock production: The recorded human/livestock ratios and density, in the study area as well in the whole Sidama and in the rest of Ethiopia, are given in Table 2. In spite of population pressure, livestock density in the area is higher than in the rest of the Awraja and of Ethiopia. On the other hand, the ratio of TLU per HH is lower.
Some 96% of the interviewed heads of HHs own livestock and about 89.2% own cattle (see Table 4). Cattle numbers are a good indicator of wealth, and ownership of more than three heads per HH is associated with an estimated annual income above E. Birr 1,000. In fact, the average herd size in a low income HH is 2.5 cattle, while in a wealthy one it is four cattle (P< 0. 001). The average herd structure is typically milk-calf production oriented (Figure 4). Oxen, as well as equine animals which are used as source of draught power, are owned only by farmers with larger land plots. The recorded production parameters are typical of a rather stable and productive traditional herd (Table 5). Farmers identified the main causes of losses in calves as diarrhoea and emaciation, while in adults poisoning, internal parasitism, clostridiosis and diarrhoea. Offtake comprises essentially sales.
Small ruminants are less diffused than cattle although they are probably more suitable to the local farming conditions (Tables 2 and 4). Animal production in the midlands is indeed milk-oriented and small ruminants cannot fulfil this important demand, especially sheep, because of a well-rooted food taboo. However, once this taboo is neglected, goats are gradually replacing other domestic ruminants. The recorded difference between lambing and kidding rates was significant (P<0. 01). The average flock size is not associated with income or land plot size (P>0. 1). Farmers say that the major causes of death in small ruminants are parasitism and predation. Offtake is in the form of sales. However on special occasions, such as birth of a child, special visits or sickness of a member, small ruminants are slaughtered to be consumed within the HH.
Chicken are bred independently of HH income as well. The mortality rate is quite high (39.2%) and affects mostly chicks. The major causes of death are predation by hawks (86.3%), diseases (12.1%) and accidents (1.6%). The recorded offtake was 22.7%. 3/4 of it was due to consumption by the members of the family.
Each beehive produces 3-3.5kg of honey which is used to produce local hydromel: “teij”. Fifty-nine percent of the cattle owners, regardless of their income, vaccinated their animals against major infectious diseases. In 44% of the herds there was a need for veterinary assistance during the year which, for the great majority, concerned cattle. Only two farmers obtained information on how to improve their livestock production. Of the 40 farmers who needed veterinary care during the reference year, 24 (60%) used traditional medicine, 10 (25%) modern medicine and 6 (15%) both. The choice was not associated with HH income level (P>0. 1). The major constraints in animal husbandry identified by farmers are given in Figure 5. Grazing areas are often limited to open meadow in front of the house and to scarce fallow land. By-products, mainly ensete leaves and maize stover, are given as feed to livestock in the dry season. However, according to farmers, an abundant diet of ensete leaves can cause severe enteritis, notably in young animals. Local coarse grass (Pennisetum scimperi), commonly found in common pastures and rich in silicates, is possibly responsible for early consumption of teeth in livestock.
Market prices: Seasonal dynamics of the price of common agricultural products are given in figures 6 and 7. Prices are higher in villages near the main tarmac road and the Awraja capital, Yerg' Alem (i.e., Weinenata and Ferro).
Food habits: Vegetable products are gradually replacing food of animal origin as maize is gradually replacing wasa in the diet. In families owning cattle, wasa is eaten with milk or butter. The latter food is considered as being very nutritive and used by well off families for weaning their children. Vegetables and fruit, on the other hand, are considered as being of little nutritive value. 45% of the farmers interviewed believe that good nutrition is based on food of animal origin and 28.4% believe that malnutrition is caused by the absence in the diets of such food. These beliefs are probably linked to the traditional pastoral life-style of local ethnic groups. However, 63.7% of the heads of HHs are aware that an unvaried diet is an important cause of malnutrition.
Expenditures: The main expenditures in the HH throughout the year are, in order of priority: food (82.1%), clothes (14.7%), taxes and contributions (2.9%). Priority in expenditure items is not related to the HH income (P>0. 1).
Risk factors in child malnutrition
As shown in Table 7 child malnutrition is strongly associated with an estimated income of less than 1100 E. Birr (P<0. 001). The mean gross income in HHs with a well nourished child is E. Birr 1471 (C. L. 92.9) while in the other group this is E. Birr 893 (C. L. 71.3). This difference is significant (P<0. 001). Income pro capita was not associated with malnutrition (P>0. 1). Moreover, the average size of HHs with a malnourished child was 6.8, while for HHs with well-nourished children it was 6.2. This difference was not significant (P>0. 1). Therefore, larger families are not more vulnerable.
Cattle ownership is a good indicator of wealth and a predictor of the child nutritional status (P<0. 01). Ownership of more that three cattle is associated with high income levels and good nutritional status of the child (respectively P<0. 001 and P<0. 005), see table 8. There is no confounding effect between the two factors. The correlation coefficient between income and herd size is 0. 73.
The association between different house conditions and levels of income, and between house conditions (hence of a income proxy) and malnutrition were both highly significant (P< 0. 001), see table 9. Bed or radio ownership are poor wealth or malnutrition indicators (P<0. 01), may be because of the small sample size.
The combination of number of cattle owned and house condition is an excellent predictor of nutritional risk, with an odd ratio of 15.5.
Malnutrition was not associated with number of wives nor with land plot size (P>0. 1). On the other hand, it was related to lower levels of efficiency in land utilization (Table 10).
No significant difference in agricultural practices or in awareness of nutritional problems was observed between the two groups of HHs.
At the time of the interviews, the gardens belonging to low income farmers presented most of the maize already harvested, hence before its optimal maturation. Ensete plants older than five years were also more frequently found in the garden of wealthy HHs.
Conclusions
Caution is needed while interpreting data obtained from official statistics or questionnaires (see for example, Chambers, 1983 and Gill, 1993). Bearing this in mind, the study, of which the results are consistent with the demographic and productive patterns recorded by broader surveys carried out by the Ministry of Agriculture (1984) and by JNSP, points out that:
- The prevalent farming system of the midlands of Sidama is under stress mainly because of burgeoning human population. Symptoms are not only the high proportion of children acutely or chronically affected by malnutrition but also the progressive degradation of resources in an environment once extremely fertile. Land erosion is commonly observed by farmers who consider it a major problem though in some plots nutrients surplus, as unused manure, was observed. Hurni (1988) classified soil erosion in Sidama as medium (20–40%). Pastureland is shrinking and degrading in its botanical composition. Most of the abundant water resources are now polluted.
- In order to buffer the progressive crisis, and given the presence of markets for cash crops and dairy products, the mixed system in Sidama midlands is rapidly evolving into specialization. The area is among the richest in Ethiopia (MOA, 1984). Because of their positive role as a source of cash in the HH economy, coffee and chat plants are gradually replacing food crops in the garden such as ensete, yam and maize. Nowadays, food is the main expenditure while in the 1970s it was clothing (Ayele, 1975; Hamer, 1987). The latter author, comparing HH income and expenditure balances between the 1960s and 1970s, points out that a sign of the vulnerability of the Sidama productive system today under stress is the increasing imbalance in favour of expenditures which can only be partially covered by previous years' savings. However, further specialization will reduce the flexibility of the system and make it more vulnerable because of its heavy dependency on remote markets beyond the reach of farmers' control (particularly in the case of coffee).
- The situation in Sidama could somehow be considered intermediate between what was observed in the Rwanda highlands (von Braun et al., 1991) and the positive Machakos case, Kenya (English et al., 1992). Nevertheless, Sidama has less marketing opportunities than Machakos and the enrolment rates for primary schools reported from Ethiopia may reduce the possibility of off-farm employment, for local farmers. As stated by von Braun et al. (1991), since rapid population growth contributes significantly to rural poverty, areas under such pressure may build their economic sustainability less and less upon agriculture alone. National land reforms have to be carefully designed and monitored to avoid low income HHs, in order to pay their debts, giving away their plots to well off farmers.
- The main underlying factor of malnutrition in children of Sidama is poverty. The parallel study carried out in the same area showed that child care and mother behaviour is not a major determinant of the phenomenon (Zagaria N., personal communication). Although child mortality is higher in poor HHs, when analysing the nutritional status of the siblings of infants included in the study and comparing it with the results of the present investigation, it came out that the protective effect of the family income on children decrease soon after they are weaned. Also wealthy HHs have stunted or underweight older children, though in a lower proportion than poor families (Ghirotti M., Zagaria N. and Tekle E., unpublished results).
A major conclusion of this study is that livestock play a protective role against land degradation and poverty. Such role against poverty and hence child malnutrition is associated with the possibility to diversify HH production and diet. There is no major difference in the skill and knowledge of members from low or high income HH. The main difference lies in the possibility to modulate their production and marketing strategies. High income farmers have a good area of manoeuvre within which they can adapt their decisions according to rapidly changing conditions. On the contrary, in order to cope with their immediate survival needs, low income farmers have to sell products soon after harvest, when prices are low, or consume them before they become ripe and reply on traditionally standardized husbandry techniques developed when pressure on local natural resources was less intense. The latter HHs have limited choices that are reduced every year or in every round of the “spiral of necessity” shown in Figure 8.
Acknowledgements
This paper is dedicated to the Ethiopian field workers, an example of devotion in performing their tasks, and to the memory of: Reginald Bark Griffiths (1920 – 1997), John William Coltrane (1926 – 1967), and Sophie Ali (1954 – 1990).
The study was performed within the field work programme of the “International Course for Primary Health Care Managers at District Level in Developing Country” (Istituto Superiore di Sanità, Rome), supported by the Italian Technical Cooperation. The author is very grateful to: R. Guerra, course supervisor; E. Tekle, Ethiopian Nutritional Institute, and the staff of the UNICEF/WHO Joint Nutritional Support Programme, Sidama; S. Sanford, ILCA; D. Nabarro; S. Babsa, typist; G. Beccaloni, FAO documentarist; and Zebenay I., interpreter.
References
Ayele G. M. (1975) The Forgotten Aborigines Livestock and Meat Board, Addis Ababa.
Biasiutti R. (1959) Razze e Popoli della Terra, III vol., UTET, Torino.
Brumby P. J. (1986) The International Livestock Centre for Africa: objectives, activities and future International Livestock Centre for Africa, Addis Ababa.
Chambers R. (1983) Rural Development: Putting the Last First. Longman, London.
Conway G. R. (1985) Rapid Rural Appraisal for Agroecosystem Analysis. Aga Khan Foundation (UK), London.
de Leeuw P. N. and Reid R. (1995) Impact of human activities and livestock on the African environment: an attempt to partition the pressure. In: Proceedings of the Joint FAO/ILRI Roundtable on Livestock Development Strategies for Low Income Countries, Addis Ababa, 27 February-2 March 1995, 29–39.
English J. , Tiffen M. and Mortimore M (1993) Land Resource Management in the Machakos District, Kenya 1930–1990. World Bank Environment Paper n. 5. World Bank, Washington D. C. .
Ghirotti M. (1992) Rapid Rural Appraisal Techniques: a tool for planning and managing animal health and production development programmes. In: Proceedings of the Conference of the Society for Veterinary Epidemiology and Preventive Medicine, Edinburgh: 1–3 April 1992, 190–206.
Ghirotti M. (1995) Farming practices and patterns in coffee-growing midlands of Sidama - Ethiopia Riv. Agr. Subtrop. e Trop., 89, 5–28.
Gill G. J. (1993) O.K., the Data's Lousy, but It's All We've Got (Being a Critique of Conventional Methods). Gatekeeper series n. 38. International Institute for Environment and Development, London.
Hamer J. H. (1987) Humane Development-Participation and change among the Sadama of Ethiopia The University of Alabama Press, Tuscaloosa.
Hurni H. (1988) Ecological issues in the creation of famine in Ethiopia, Paper presented at the National Conference on Disaster Prevention and Preparedness Strategy for Ethiopia, Addis Ababa, 5–8 December 1988.
Jahnke H. E. (1982) Livestock Production Systems and Livestock Development in Tropical Africa. Kieler Wissenschaftsverlag, Kiel.
Jonsson O. (1984) Child Survival and Development, a Proposed Conceptual Approach. In: the Programming Workshop for the preparation of the next UNICEF Board Recommendations. Dar es Salaam, 11–15 June 1984.
McEntire J., Bouzat D. and Pingali P. (1992) “Crop- livestock interaction in sub-Saharan Africa” The World Bank, Washington D. C.
Ministry of Agriculture (1984) “General Agriculture Survey, Preliminary Report, 1983/84” Planning and Programming Dpt., Addis Ababa.
Nabarro D. (1981) “Social, economic, health and environmental determinants of nutritional status” Food. nutr. Bull., 6, 38–47.
Payne P. R. (1977) “Socioeconomic cause of malnutrition”. In: Nutrition in Developing Countries, ed. by Korte R., GTZ, Eschborn, 93–114.
Raya A. (1987) “Report of the Diagnostic Survey of Sidama Farming Systems Zone”, Institute of Agriculture Research, Awasa, Ethiopia.
Ruthenberg H. (1980) “Farming Systems in the Tropics” Clarendon Press, Oxford.
Spedding C. W. R. (1981) “An Introduction to Agricultural Systems” Applied Science Pub., London.
Steinfeld H., de Haan C. and Blackburn H. (1997) “Livestock - Environment Interactions: Issues and Options”.
Victora C. G., Vaughan J. P., Kirkwood B. R., Martines J. C. and Barcelos L. B. (1986) “Risk factors for malnutrition in Brazilian children: the role of social and environmental variables”, WHO Bull., 64, 299–309.
Von Braun J., de Haen H. and Blanken J. (1991) “Commercialization of Agriculture under Population Pressure: Effects on Production, Consumption and Nutrition in Rwanda”. Research Report n. 85. International Food Policy Research Institute, Washington D. C. .
Westphal E. (1975) “Agricultural Systems in Ethiopia”, PUDOC, Wageningen.
Table 1: Land holding frequency per household in Sidama midlands (n=102)
| cultivated land (hectare) | frequency |
|---|---|
| <0. 5 | 81 |
| 0. 5–1 | 17 |
| >1 | 2 |
Table 2: Human and livestock population densities in Ethiopia, Sidama and sampled Midlands (Sources: UN, JNSP and study data)
| Ethiopia | Sidama | Midlands | |
|---|---|---|---|
| Population/Km2 | 32.7 | 254.2 | 525* |
| cattle/people | 0. 65 | 0. 65 | 0. 48 |
| small rumin. /people | 1 | 0. 14 | 0. 11 |
| equines/people | 0. 18 | 0. 04 | 0. 02 |
| TLU/HH** | 4.15 | 2.99 | 2.17 |
| cattle/Km2 | 21.3 | 165.8 | 252.6 |
| small rumin. /Km2 | 32.7 | 34.6 | 55.4 |
| equines/ Km2 | 5.7 | 9.1 | 8.7 |
| TLU/Km2 | 22.6 | 126.6 | 190. 1 |
Table 3: frequency of households cultivating major crops (n = 102)
| crops | no of HHs | crops | no. of HHs |
|---|---|---|---|
| ensete | 102 | banana | 69 |
| maize | 102 | sugarcane | 67 |
| coffee | 100 | chat | 65 |
| kale | 95 | red pepper | 65 |
| pumpkin | 88 | sweet potatoes | 47 |
| yam | 79 | avocado | 38 |
| orange | 73 | guava | 11 |
Table 4: number of households breeding livestock (n = 102)
| species | no of HHs | total number in the sample |
|---|---|---|
| cattle | 91 | 319 |
| goats | 18 | 42 |
| sheep | 17 | 28 |
| donkeys | 10 | 10 |
| horses | 1 | 1 |
| chicken | 62 | 214 |
| beehives | 14 | 43 |
| no livestock | 4 | --- |
Table 5: Production rates recorded in cattle of Sidama Midlands (n = 369)
| Calving % | Mortality % | Off take % | |
|---|---|---|---|
| calf | adult | ||
| 61.5 | 24.2 | 2.8 | 6.2 |
Table 6: Production rates in small ruminants of Sidama Midlands (n = 33 + 57)
| Birth | Mortality | Off take | |
|---|---|---|---|
| sheep | 58.8* | 0 | 12 |
| goats | 95.4* | 3.3 | 9.6 |
Table 7: Child nutritional status and estimated household income
| Estimated household income | ||
|---|---|---|
| <1,100 E. birr | >1,100 E. birr | |
| Well nourished | 17 | 40 |
| Malnourished | 32 | 9 |
P < 0. 001 O. R. =8.37 C. L. =95%
Table 8: Child nutritional status and number of owned cattle (n = 98)
| Owned cattle | ||
|---|---|---|
| 0–3 | >3 | |
| Well nourished | 27 | 30 |
| Malnourished | 31 | 10 |
P < 0. 05 O. R. =3.44 C. L. =95%
Table 9: Child nutritional status and productivity per hectare (n = 98)
| E. Birr/0. 1 hectare | |
|---|---|
| Well nourished | 51.63(+3.9) |
| Malnourished | 27.63(+2) |
P<0. 001 C. L. =95%
Table 10: House condition and children nutritional status (n = 98)
| house condition | |||
|---|---|---|---|
| poor | average | good | |
| well nourished children | 4 | 15 | 38 |
| malnourished children | 22 | 8 | 11 |
P<0. 001 O. R = 15.34 95% C. L.
Figure 1: Map of Sidama (*=sampled village)

Figure 2: Household age-sex distribution
% of the different age-sex group in the interviewed households, average value
% of the different age-sex group in the interviewed households, average value

Figure 3: Main problems in crop production

Figure 4: Average herd composition

Figure 5: Main problems in livestock production

Figure 6: Monthly variation of the price for one horse load of ensete

Figure 7: Monthly variation of the price for one qt of coffee or barley in Aleto Wondo

Figure 8: The spiral of necessity


Comments
Post a Comment